Carolina State Climate Office
Lake and Buoy Observations
Start date-10/20/2016 - 1800 UTC
End date-10/20/2016 - 1921 UTC
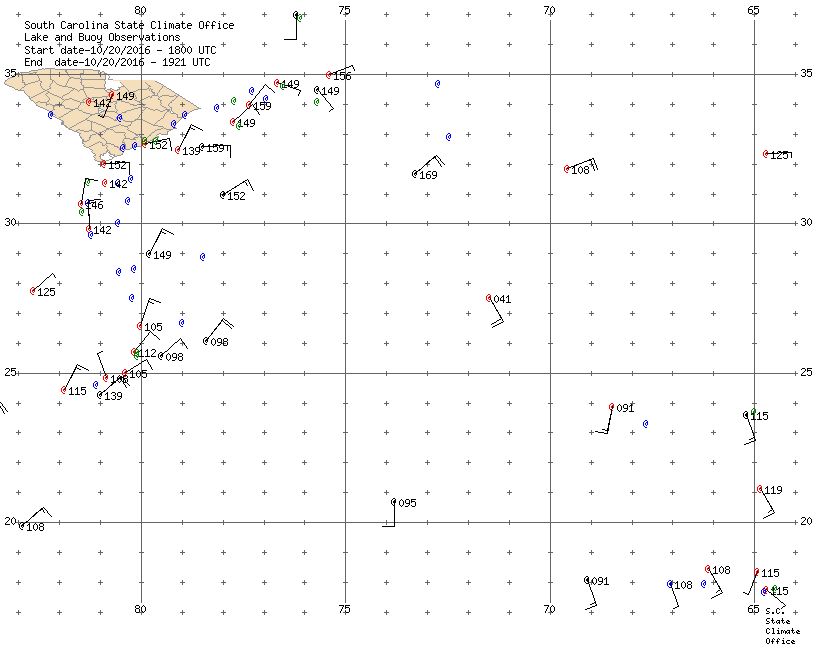
Buoys are plotted in red , ships plotted in black and missing data plotted in blue. Some closely spaced
data points are plotted in green and may be viewed by moving the cursor over the data point.
Observation times are in UTC.Time - Coordinated Universal Time, abbreviated UTC. This was formerly known as Greenwich Mean Time (GMT). Other terms used to refer to it include "Zulu time (Z)", "universal time," and "world time".
Conversion:
Easter Standard Time: UTC - 5 hours.
Easter Daylight Time: UTC - 4 hours.
Some data, including Wind wave and SwellWind wave and swell data are displayed as:
HGT - Wave height is the vertical distance (feet) between any wind wave/swell crest and the succeeding wind wave/swell trough (independent of swell/wind waves).
PER - Wave period is the time (in seconds) that it takes successive wave crests or troughs to pass a fixed point.
DIR - Wave direction is the compass direction (degrees) from which the waves are coming.
STP - Steepness is reported as either "VERY STEEP", "STEEP","AVERAGE", or "SWELL". For a given wave height, steep waves represent a more serious threat to capsizing vessels or damaging marine structures than broad swell. It is determined by examining the significant wave height and the dominant wave period when compared to climatology.
, may be displayed
by moving the cursor over the plotted @ The barbs indicate the direction the wind is blowing from. Wind speeds are plotted to the nearest 5 knots (short barbs). The long barbs indicate 10 knots. A triangle flag indicates 50 knots.
Sea level pressure is plotted in millibars (tens, units, and tenths). Example 1013.6 millibars is plotted as 136.
Moving the cursor over the plotted data will show (if available) the direction from which the wind is blowing (degrees), the wind speed and gust (knots), sea level pressure in millibars. The air, sea and dew point temperatures are in degrees Fahrenheit. symbol. All observations may be viewed in table format.
Display only the GIF image.
Data courtesy of the National Data Buoy Center.
