
GAP Data Overview
The following index lists GAP Data by category: Land Cover, Species Habitat, Species Richness, and Land Stewardship. Various links to metadata and available data to download for a specific topic are provided within each category. Select the link under the category 'Raw Data Download', to view a list of available data to download at no cost. To view additional information about that data category, select the link under the topic 'Metadata'.
GAP map layers are in the ESRI GRID format and compressed into a zip file for downloading. Once the downloading file is unzipped, the grid and related info directories will be installed in a folder or ESRI ArcInfo workspace. The size of the uncompressed data file ranges from 1 to 90 MB. To be able to process the data, users must have GIS or image processing software supporting ESRI GRID data model. To start downloading, please select the layer of interest.
Land Cover
Overview
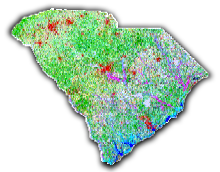
The land cover maps the state's natural and man-made vegetation types. Available through this website is a 27-class land cover which was created and used for modeling distributions of vertebrate habitats. The accuracy of the map was determined through a combination of aerial photography and ground assessment points that were compared with the land cover. For more information about the accuracy assessment, please refer to the Accuracy Assessment section of GAP final report.
Classification
The satellite imagery used for the classification was Landsat Thematic Mapper (TM). The selected scenes from 1991 through 1993 covering the state were acquired from the Multi-Resolution Land Characteristics Consortium (MRLC). The original 30 x 30 meter pixel resolution was maintained throughout the classification process. The classification of vegetation was performed in two steps, the production of an initial classified image using 27 general classes and the refinement of that classification using soil surveys, National Wetlands Inventory surveys, and elevation data.
Species Habitat
Common Names
Scientific Names
Raw Data Download
Metadata
Overview
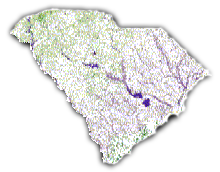
The habitat maps provide information about the predicted distribution of individual native species according to actual habitat characteristics within their general ranges, and allow calculation of predicted area of distributions and associations to specific habitat characteristics. The predicted distributions are generated for 455 vertebrate species that regularly occur and are relevant to biodiversity studies in South Carolina. Those species include 65 amphibians, 73 reptiles, 249 birds, and 68 mammals.
Habitat Modeling and Mapping
Scientific literature and expert opinion were used to develop a list of vertebrate species and to model their potential spatial distributions. These models combined habitat affinities and land cover data to create distribution maps that highlighted areas whose vegetation was capable of supporting individual vertebrate species. Modeling took place by attributing each species to the counties where it was known to occur and to the habitat types it used within those counties. Arc/Info scripts were developed to attribute each species to the appropriate counties and habitat. This resulted in a map with 30 x 30 meter pixel resolution attributing each species to a predicted habitat within its documented range. The accuracy of the predicted vertebrate distributions was assessed by comparing a list of species that SC-GAP predicts would be present at a site to a list of species known to occur at a site. The accuracy ranged from 57% to 85% depending on the site.
Land Cover Classes
The vegetation classes include the following types: fresh water, marine water, marsh/emergent wetland, pocosin, swamp, bottomland/floodplain forest, wet soil, wet scrub/shrub thicket, dry scrub/shrub thicket, sandy bare soil, open canopy/recently cleared forest, rock outcrop, aquatic vegetation, closed canopy evergreen forest/woodland, needle-leaved evergreen mixed forest/woodland, pine woodland, dry deciduous forest/woodland, mesic deciduous forest/woodland, dry mixed forest/woodland, mesic mixed forest/woodland, grassland/pasture, cultivated land, urban development, urban residential, wet evergreen, maritime forest, and beach. Detailed descriptions of each land cover class are provided in Appendix 1 of the SC GAP report.
Species Richness
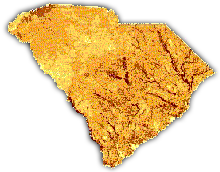
Overview
The species richness map shows species-rich areas or "hotspots." The map identifies where the same numbers of elements co-occur in the same geographic locations. In the case of our data, numbers of animal species are mapped for the same grid cells with a cell size of 90 x 90 meters. These are color-coded or shaded in intensity from the highest numbers of co-occurrence (richness) to the lowest. Richest areas may or may not indicate best conservation opportunities. The 455 vertebrates have been divided into four categories: Amphibian, Bird, Mammal, and Reptile. The richness maps are available for each individual species group and also for all species.
Land Stewardship
Overview
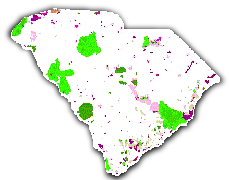
The land stewardship data were created to compare the mapped distribution of elements of biodiversity with their representation in different categories of land ownership and management. Four status categories were used to denote relative level of biodiversity management for each land tract. A status of "1" denoted the high test level of management, and "4" represented the lowest level of biodiversity management, or unknown status.
Data Sources
The stewardship data were collected from many sources and compiled using survey, database, and GIS techniques. Many of the spatial property files were extracted from field maps, plat, tax maps, and Digital Line Graph (DLG) data. Major data contributors included SCDNR Land Resources Division, U.S. Fish and Wildlife Service's Coastal Ecosystem Program, and U.S. Forest Service.
Stewardship Mapping
Data from various sources and contributors were processed to create the data set of 1:24,000 scale coverages. Each of those polygon coverages was constructed using the Arc/Info GIS and was transferred between agencies. All features were inspected for resolution and positional accuracy. The redundant or antiquated data were eliminated. A single statewide data set was generated by combining remaining features. Once the data were integrated, additions and modifications to existing properties were evaluated by all state and federal agencies and land management organizations in the state before they were added into the database.
Stewardship Status
Status 1: An area having permanent protection from conversion of natural land cover and a mandated management plan in operation to restore and/or maintain a natural state within which disturbance events (of natural type, frequency, intensity, and legacy) are allowed to proceed without interference or are mimicked through management. This classification may include hunting activities if hunting is not actively managed for.
Status 2: An area having permanent protection from conversion of natural land cover and a mandated management plan in operation to maintain a primarily natural state, but that may receive uses or management practices that degrade the quality of existing natural communities, including suppression of natural disturbance. This status includes lands that may be managed for hunting.
Status 3: An area having permanent protection from conversion of natural land cover for the majority of the area, but subject to extractive uses of either a broad, low-intensity type (e.g., logging) or localized intense type (e.g., mining). It also confers protection to federally listed endangered and threatened species throughout the area.
Status 4: There are no known public or private institutional mandates or legally recognized easements or deed restrictions held by the managing entity to prevent conversion of natural habitat types to anthropogenic.