DNR News** Archived Article - please check for current information. **
2017 Bobwhite Quail Whistling Cock Census November 8, 2017

More quail were heard calling this year than any year since 2012.

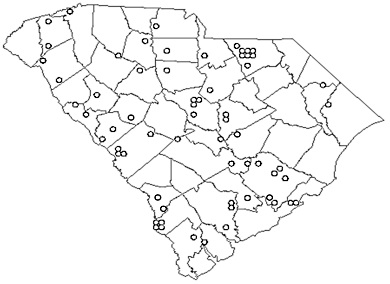
Figure 1. South Carolina Bobwhite Quail Whistling Cock Census route locations: 1979 - 2017.
Methods
Census routes are sampled between 15 June and 10 July, believed to be the period of maximum bobwhite whistling in the Southeast (Rosene 1969). Each route consists of 12 stops at 1/2 mile intervals. Exactly 8 minutes are allotted for listening at each stop, beginning at official sunrise. The number of calling males is recorded at each stop and totaled for the entire route. Route totals are used for statistical comparisons. Weather conditions are also recorded, and operation of routes is discouraged on rainy or windy days. Based on an extensive analysis of historical Whistling Cock Census data, the survey protocol was changed in 2003 from a two-day survey to a one-day survey. The afternoon listening period was also eliminated as an option in the survey protocol.
As in previous years, data were analyzed using a paired t-test for equal sample sizes (Steel and Torrie 1980). Between-year comparisons were conducted using all routes that were run in both 2016 and 2017. The 2017 mean was also compared with the long-term average using a paired t-test.
Results and Discussion
Fifty-six observers surveyed 62 routes in 2017. Fifty-seven of these routes were used in year-to-year comparisons. A total of 293 whistling cocks were recorded on the 57 routes for an average of 5.1 + 0.83 (SE) birds/route. For all routes sampled, the average number of calling birds was 5.2 + 0.79 (SE) birds/route (Table 1).
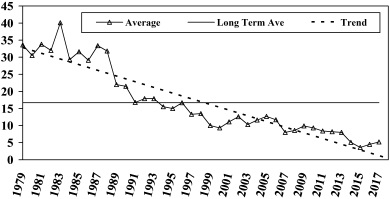
The 2017 mean call count index is not significantly different (P > 0.05) from the 2016 index. The 2017 index is significantly below (P < 0.01) the long-term average for the 39 years of the census (16.7 birds/route, N=1874, Fig. 2).
Table 1. Summary of South Carolina Bobwhite Quail Whistling Cock Census, 1979-2017.
| Year | Number of Routes | >Calling Males/Route (Average) |
|---|---|---|
| 1979 | 18 | 33.6 |
| 1980 | 19 | 30.5 |
| 1981 | 26 | 33.8 |
| 1982 | 28 | 32.0 |
| 1983 | 27 | 40.1 |
| 1984 | 28 | 29.3 |
| 1985 | 28 | 31.6 |
| 1986 | 30 | 29.1 |
| 1987 | 28 | 33.4 |
| 1988 | 28 | 31.8 |
| 1989 | 38 | 22.0 |
| 1990 | 39 | 21.5 |
| 1991 | 40 | 16.8 |
| 1992 | 43 | 17.9 |
| 1993 | 44 | 17.9 |
| 1994 | 47 | 15.5 |
| 1995 | 51 | 15.0 |
| 1996 | 53 | 16.7 |
| 1997 | 52 | 13.3 |
| 1998 | 53 | 13.5 |
| 1999 | 56 | 10.0 |
| 2000 | 57 | 9.3 |
| 2001 | 56 | 11.1 |
| 2002 | 59 | 12.6 |
| 2003 | 60 | 10.3 |
| 2004 | 61 | 11.6 |
| 2005 | 61 | 12.7 |
| 2006 | 62 | 11.7 |
| 2007 | 63 | 8.0 |
| 2008 | 63 | 8.6 |
| 2009 | 66 | 9.9 |
| 2010 | 67 | 9.3 |
| 2011 | 68 | 8.4 |
| 2012 | 64 | 8.2 |
| 2013 | 62 | 8.0 |
| 2014 | 47 | 5.1 |
| 2015 | 59 | 3.6 |
| 2016 | 63 | 4.5 |
| 2017 | 62 | 5.2 |
| 39-year average | 48.1 | 16.7 |
Quail call counts in 2017 were higher on 22 routes (39%) and lower on 21 routes (37%) compared to 2016. Statewide, there were 24 more birds recorded in 2017 than were heard on the same routes in 2016, an increase of 8.92 percent.
Because of natural mortality, breeding populations of quail are never high relative to early fall populations. Extreme weather conditions during the nesting season and land-use changes can further depress quail numbers.

Figure 2: Average Bobwhite Quail Whistling Cock Census call count (birds/route) in South Carolina 1979-2017, trend and long-term average for the period.
Whistling Cock Survey data are used in conjunction with Quail Brood Survey data, Quail Hunter Survey data, and Fall Covey Count data to assess the population status of quail statewide as well as the effects of land use change and other factors, such as weather, on the statewide quail population.
Land-use changes surrounding routes is the most difficult variable to qualify. When routes for the Whistling Cock Census were established in 1979, cooperators were instructed to locate census lines in areas where good quail populations existed. Routes are not moved to new locations unless access is limited or noise disturbance (e.g. road traffic) makes counting calling birds impossible. Many routes which were established through mixed forest and farmlands are now surrounded by pine plantations. Therefore, a dramatic decrease in the suitability of the habitat surrounding survey routes is thought to have severely depressed the numbers of calling birds on many routes. While large-scale (e.g. state level) habitat changes are obvious and are easily documented, it is much more difficult to quantify habitat changes at the call count route or point level. Analysis of fine-scale habitat components along survey routes should be conducted to validate the effects of habitat change on local quail populations.
It is important to note that these routes were established to document year-to-year and long-term population changes. Thus, populations are expected to decrease for a period of time and should rebound if the habitat reverts to a more suitable type.
The Bobwhite Quail Whistling Cock Census should be continued in order to monitor changes in habitat conditions and the resultant quail population response. Additional routes are needed in areas of low route density to increase the precision of the survey and to provide more complete statewide coverage by survey routes.
Literature Cited
Rosene, W., Jr. 1969. The Bobwhite Quail: Its life and management. Rutgers University Press, New Brunswick, N. J. 418 pp.
Steel, R.G.D. and J.H. Torrie. 1980. Principles and procedures of statistics: A biometrical approach. McGraw Hill Book Company, New York. 633 pp.
| Area | Personnel | Number |
|---|---|---|
| Coastal, Midlands | David Lucas | 843-610-0096 |
| Marine | Erin Weeks | 843-953-9845 |
| Upstate, Midlands | Greg Lucas | 864-380-5201 |
After Hours Radio Room - 803-955-4000
