The Evolution of Red Drum Stock Enhancement in South Carolina
As research on red drum stock enhancement in South Carolina enters its third decade, it is important to understand how research methods have evolved and what can still be learned from the continued study of this species. One of the most important factors for an evaluation of stocking efforts is the ability of researchers to identify stocked fish in the wild. Identification of these fish allows managers to quantify the success or failure of a release and accurately assess the impact of hatchery fish on the wild population. The evolution of fish marking technologies over the past two decades has revolutionized our ability to understand the behavior of red drum in the wild.

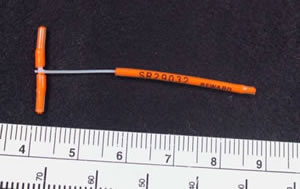
Initial stocking efforts during 1988-1992 focused on predictable spawning and juvenile production techniques for red drum and the development of stocking protocols. In order to evaluate the impact of stocking, identification of stocked fish that have been released into the wild is a critical factor. During the early years of the program, when larger fish were stocked they were tagged with easily visible external tags (fig. 1) inserted into the musculature of the fish. These tags had “Reward” messages to entice anglers to report the capture of a tagged fish. Evaluation of stocking efforts required that mortality associated with the tagging process, retention of the tag in the fish, and tag reporting rates of anglers were known. In addition, release numbers were limited by the time, cost, and space requirements of producing fish large enough for application of an external tag. The data generated from tag returns was useful for determining fish movement patterns and growth of stocked fish; however it was less useful for evaluating hatchery contribution and stocking impact.
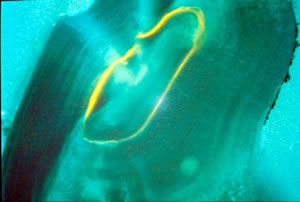
During the mid-1990s, oxytetracycline (OTC) was used to mark fish. Prior to release, fish were immersed in a bath containing OTC, which is absorbed through the gills and binds to calcium inside of the fish. Fish are typically aged by removing and sectioning the ear bone or otolith. A sectioned otolith reveals daily growth and annual rings that can be counted like rings in a tree to determine age. With the aid of a microscope and a UV light, researchers can identify an OTC-marked fish by the fluorescence of one of these daily rings (fig. 2). Chemical marking allowed researchers to begin tagging fish as small as 1 inch, greatly increasing the number of fish that could be produced and released in a season. Evaluation of stocking efforts with chemically-marked fish provided data on growth and movement, as with external tags, but it also allowed researchers to reliably estimate hatchery contribution for the first time.

While the chemical marking of small red drum greatly increased our understanding of the early life history of this species, the technique had a number of drawbacks. First and foremost, in order to examine the ear bone of a fish, researchers needed to remove it from the skull. This necessitated the sacrifice of large numbers of juvenile fish, defeating the purpose of enhancement efforts. Second, the preparation of otoliths for examination required a good deal of time and skill. Otoliths not sectioned perfectly won’t reveal the fluorescent ring. Another drawback was that hatchery fish were indistinguishable from each other. While external tags were numbered, it was nearly impossible to know exactly from which stocking year or location a chemically-marked fish was released. Additionally, since anglers could not visibly identify hatchery fish and were prohibited from taking fish below the legal size limit, they were unable to contribute to collection efforts. Finally, the chemical mark tended to fade over time, limiting the long-term tracking of stocked fish. While chemical marking represented a step forward in stock enhancement research, it wasn’t long before a more efficient technique was adopted.
In the early 2000s, SCDNR began to investigate the use of genetic tools to identify hatchery released fish. Although genetic analysis had high upfront costs for equipment, its potential use in fisheries research was compelling. Genetic analysis only requires a small tissue sample or fin clip to match against the known genetic makeup of the parents in the spawning tanks. A genetic mark is permanent, does not fade or shed over time, and is 99.9% accurate. A fin clip sample can be taken without the need to sacrifice the fish and thus fish outside of the slot limit can be sampled and recaptured multiple times providing valuable data on population size. Fish are genetically marked at fertilization, meaning red drum stocked as young as 2 days old can be identified back to their parents. They also carry this mark their entire lives allowing researchers to evaluate the hatchery contribution in the adult population, which is important for a fish that can live 40 years!
In addition to the permanence of the mark, genetic analysis allows researchers to design more complex experiments to understand the most critical life stages of red drum. Hatchery fish can be distinguished from wild fish, but hatchery fish spawned from different tanks can even be distinguished from each other, even when released in the same location. By the mid-2000s, SCDNR had moved beyond experiments to augment the wild population and was using hatchery reared red drum to understand the natural recruitment dynamics of red drum in the wild. Most recently, hatchery red drum were being used to examine questions of habitat use, carrying capacity, and movements between estuaries.
A study using multiple genetic families is currently being conducted in the Charleston Harbor estuary. The Ashley and Wando Rivers comprise two of the three river systems that flow into Charleston Harbor. Long-term data trends in statewide inshore monitoring reveal low levels of natural red drum recruitment in the Ashley and relatively high levels of recruitment in the Wando. SCDNR is using hatchery-raised red drum to evaluate habitat within the Ashley and examine red drum movement within the Charleston Harbor estuary as a whole based on size and location of stocking. While overall contribution to the estuary was nearly identical in 2009 and 2010 (35.1% vs. 35.3%, table 1), preliminary results reveal a statistically significant difference in contribution based on stocking location within the Ashley in 2009 and stocking size within the Wando in 2010. Genetic identification of the multiple hatchery releases is providing data on red drum behavior in Charleston Harbor that is unavailable through traditional monitoring of the wild population.
Table 1. Red drum stocking in the Ashley and Wando Rivers, 2009-2010.
| Year Class | River | Genetic Family | Number Released | Treatment | Contribution (%) |
|---|---|---|---|---|---|
| 2009 | Ashley | Family 1 | 86,400 | Orange Grove Crk | 2.1 |
| 2009 | Ashley | Family 2 | 543,524 | Bull Crk | 33.0 |
| 2010 | Ashley | Family 1 | 519,842 | 2 creeks | 15.4 |
| 2010 | Wando | Family 2 | 150,961 | 4 creeks | 1.8 |
| 2010 | Wando | Family 3 | 15,769 | Advanced Juveniles | 18.1 |
The evolution of fish marking technology has greatly advanced the science of stock enhancement. The development of genetic tools for identification of hatchery fish has allowed research to progress from a simple tool for augmenting depleted fish stocks into a method for quantitatively evaluating habitat usage and natural recruitment dynamics. Hatchery fish can now be followed from their first days of life through their entrance into the spawning population. The techniques developed for marking red drum are now being applied to spotted seatrout, striped bass, and cobia and are helping managers to better understand wild populations and thus become better stewards of our resources.


