Marine - Species - Black Seabass
Recreational Fishery in SC

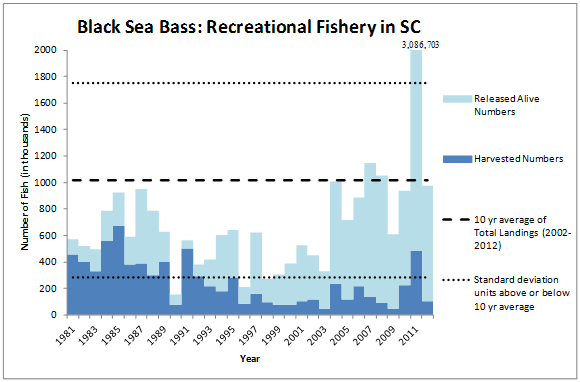
The number of harvest black seabass showed a declining trend from the late 1980's and early 1990’s through the 2000's, with a notable peak occurring in 2011. At the same time as the number of fish harvested decreased, the number of fish being caught and released alive began to increase until the mid to late 2000's where the majority of fish were being released alive. This was likely due to increased management regulations and seasonal closures during this time period. The peak year in 2011, while exceptionally high, had a very low percent standard error indicating this was a reliable catch estimate for that year. With exception of 2011, total catch has remained at approximately the same level as the 10 year average since 2004.
Commercial landings of black seabass in the last decade have remained relatively stable with the 10 yr average being 119,000 lbs. However, prior to that time period, black seabass had been in decline commercially since the early 1980's. Historic peaks occurred in the 1960's and 1970's but began to decline in the 1980's. Annual catch limits (ACL) have been in place for both commercial and recreational black seabass landings since 2008 and the typical season (opening on June 1st) lasts until the ACL is reached, after which it closes down for the year. The ACL has to be adjusted periodically in order to balance out stock maintenance and harvest levels.
The recreational catch data is provided by the National Marine Fisheries Service (NMFS), which conducts phone and angler-intercept surveys to monitor angler activities and catches. For more information see: https://www.st.nmfs.noaa.gov/.
The commercial fisheries data is provided by the National Marine Fisheries Service (NMFS), which compiles commercial information provided by state agencies. For more information, see: https://www.st.nmfs.noaa.gov/.
Additional Graph Information
Commercial and recreational catches are measured in number of individuals or pounds of fish caught. Changes in catch among years may be the result of changes in abundance, fishing effort, or a combination of the two.
On each graph, the horizontal dotted lines above or below the "10 year average" represent one "standard deviation" unit, which is a measure of how variable the annual data are around the 10-year average. In general, the area between one standard deviation above the mean and one standard deviation below the mean includes approximately 68% of all values. Approximately 95% of observations in the data set are found within two standard deviation units of the average and is referred to as the prediction interval.
